Lab 1: Extending ptrace
This assignment should be completed individually.
Due: 09/16 11:59 pm EDT
The objectives of this lab are two-fold: (1) get familiar with the basic workflow of kernel programming to prepare you for your course project; (2) understand the internals of a small part of Linux code.
Specifically, you will be extending ptrace, which is a neat and powerful system call. The ptrace system call allows a process (termed tracer) to observe and control the execution of another process (termed tracee). The tracer can inspect and modify the tracee’s registers, memory, etc. It is commonly used to develop debugging tools like gdb. If you haven’t used ptrace before, read this page to know more about it.
Requirements:
1.0 Kernel Setup
You’ll need to first setup an environment for compiling Linux kernel from source and running it. The compilation can be done in a standard Linux machine, but to run the compiled (custom) kernel, instead of using the native environment, you’ll setup a VM with Debian 12 on QEMU/KVM. If you are unsure how to create a Debian QEMU image and/or how to compile Linux kernel source, there are plenty of online tutorials that you can refer to, e.g., https://github.com/OrderLab/linux-dev-bootcamp.
You should specifically compile Linux kernel 5.10.224.
In your write-up for this exercise, report the following:
- The hardware and OS of your experiment machine
- The command lines you used to setup and run the VM
- A screenshot of the running VM showing that Linux kernel version
- The rough time you took to complete the setup
The write-up should be concise.
1.1 Understand ptrace
The next task is to read the ptrace source code. In particular, you need to find and read the part of the code that handles the PTRACE_PEEKDATA and PTRACE_POKEDATA operations. In your writeup, summarize how the kernel reads and writes the data from the tracee’s memory.
1.2 Implement Selective Memory Snapshotting
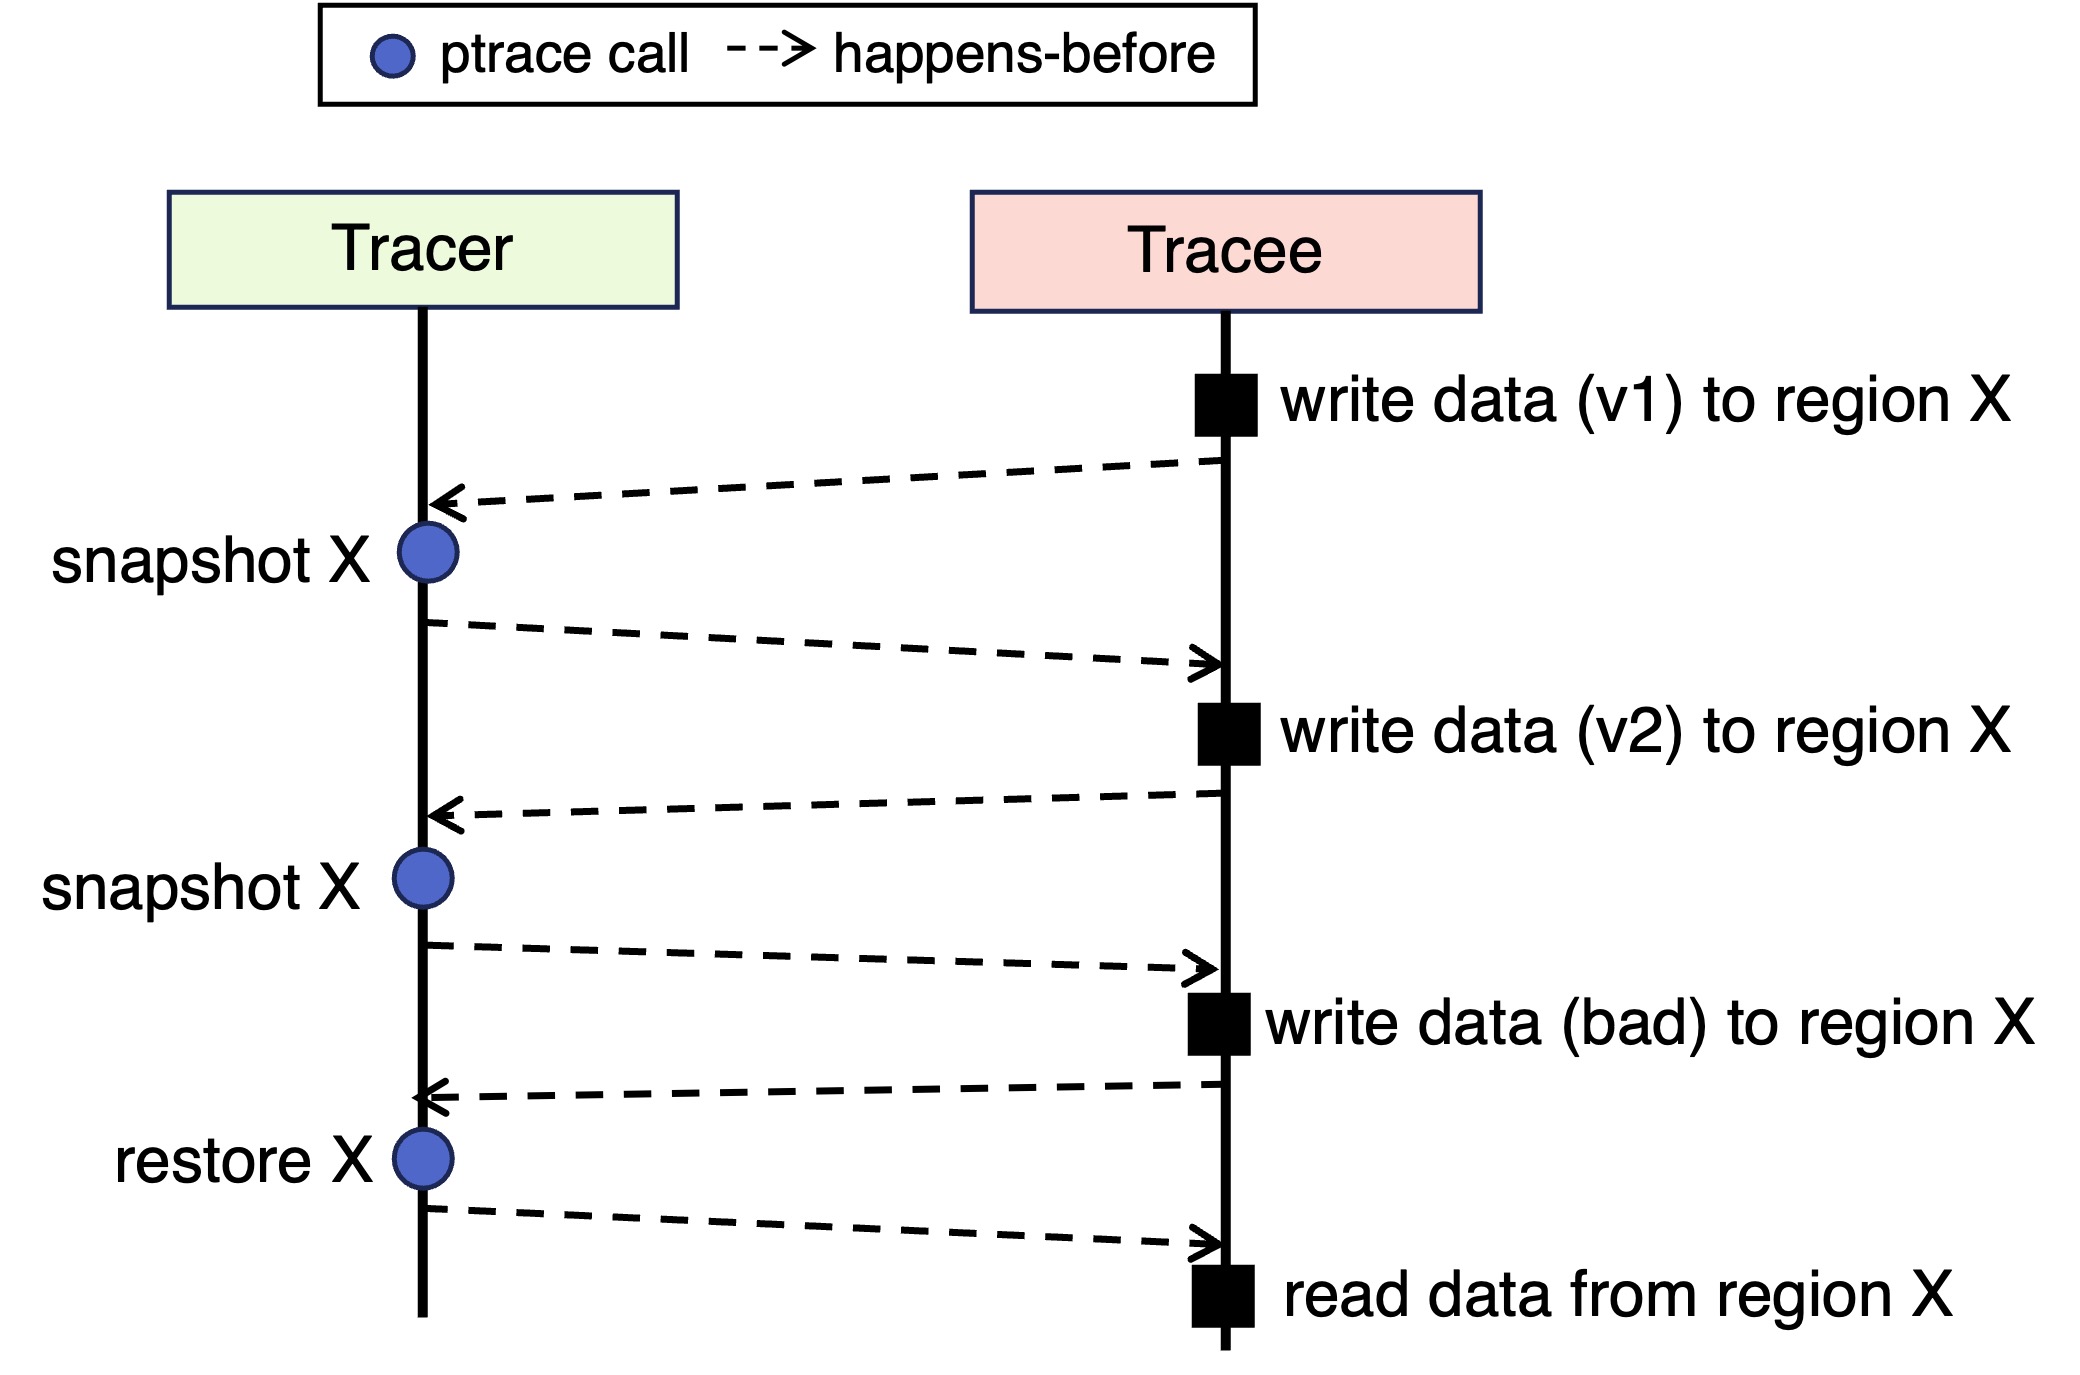
You will add a relatively small extension to ptrace to support a feature called selective memory snapshotting. The feature will allow the tracer to capture a snapshot of a specified writable memory region in the tracee’s address space, and later restore the tracee’s memory region from a previously taken snapshot. We call the snapshotting selective because it only applies to a specific region instead of the full address space.
The existing ptrace system call interface is as follows:
long ptrace(enum __ptrace_request op, pid_t pid, void *addr, void *data);
Your extension should preserve this interface, i.e., not adding or removing arguments from the function signature. The first argument of this interface, op, determines the operation to be performed. Thus, you’ll need to add three more operation types:
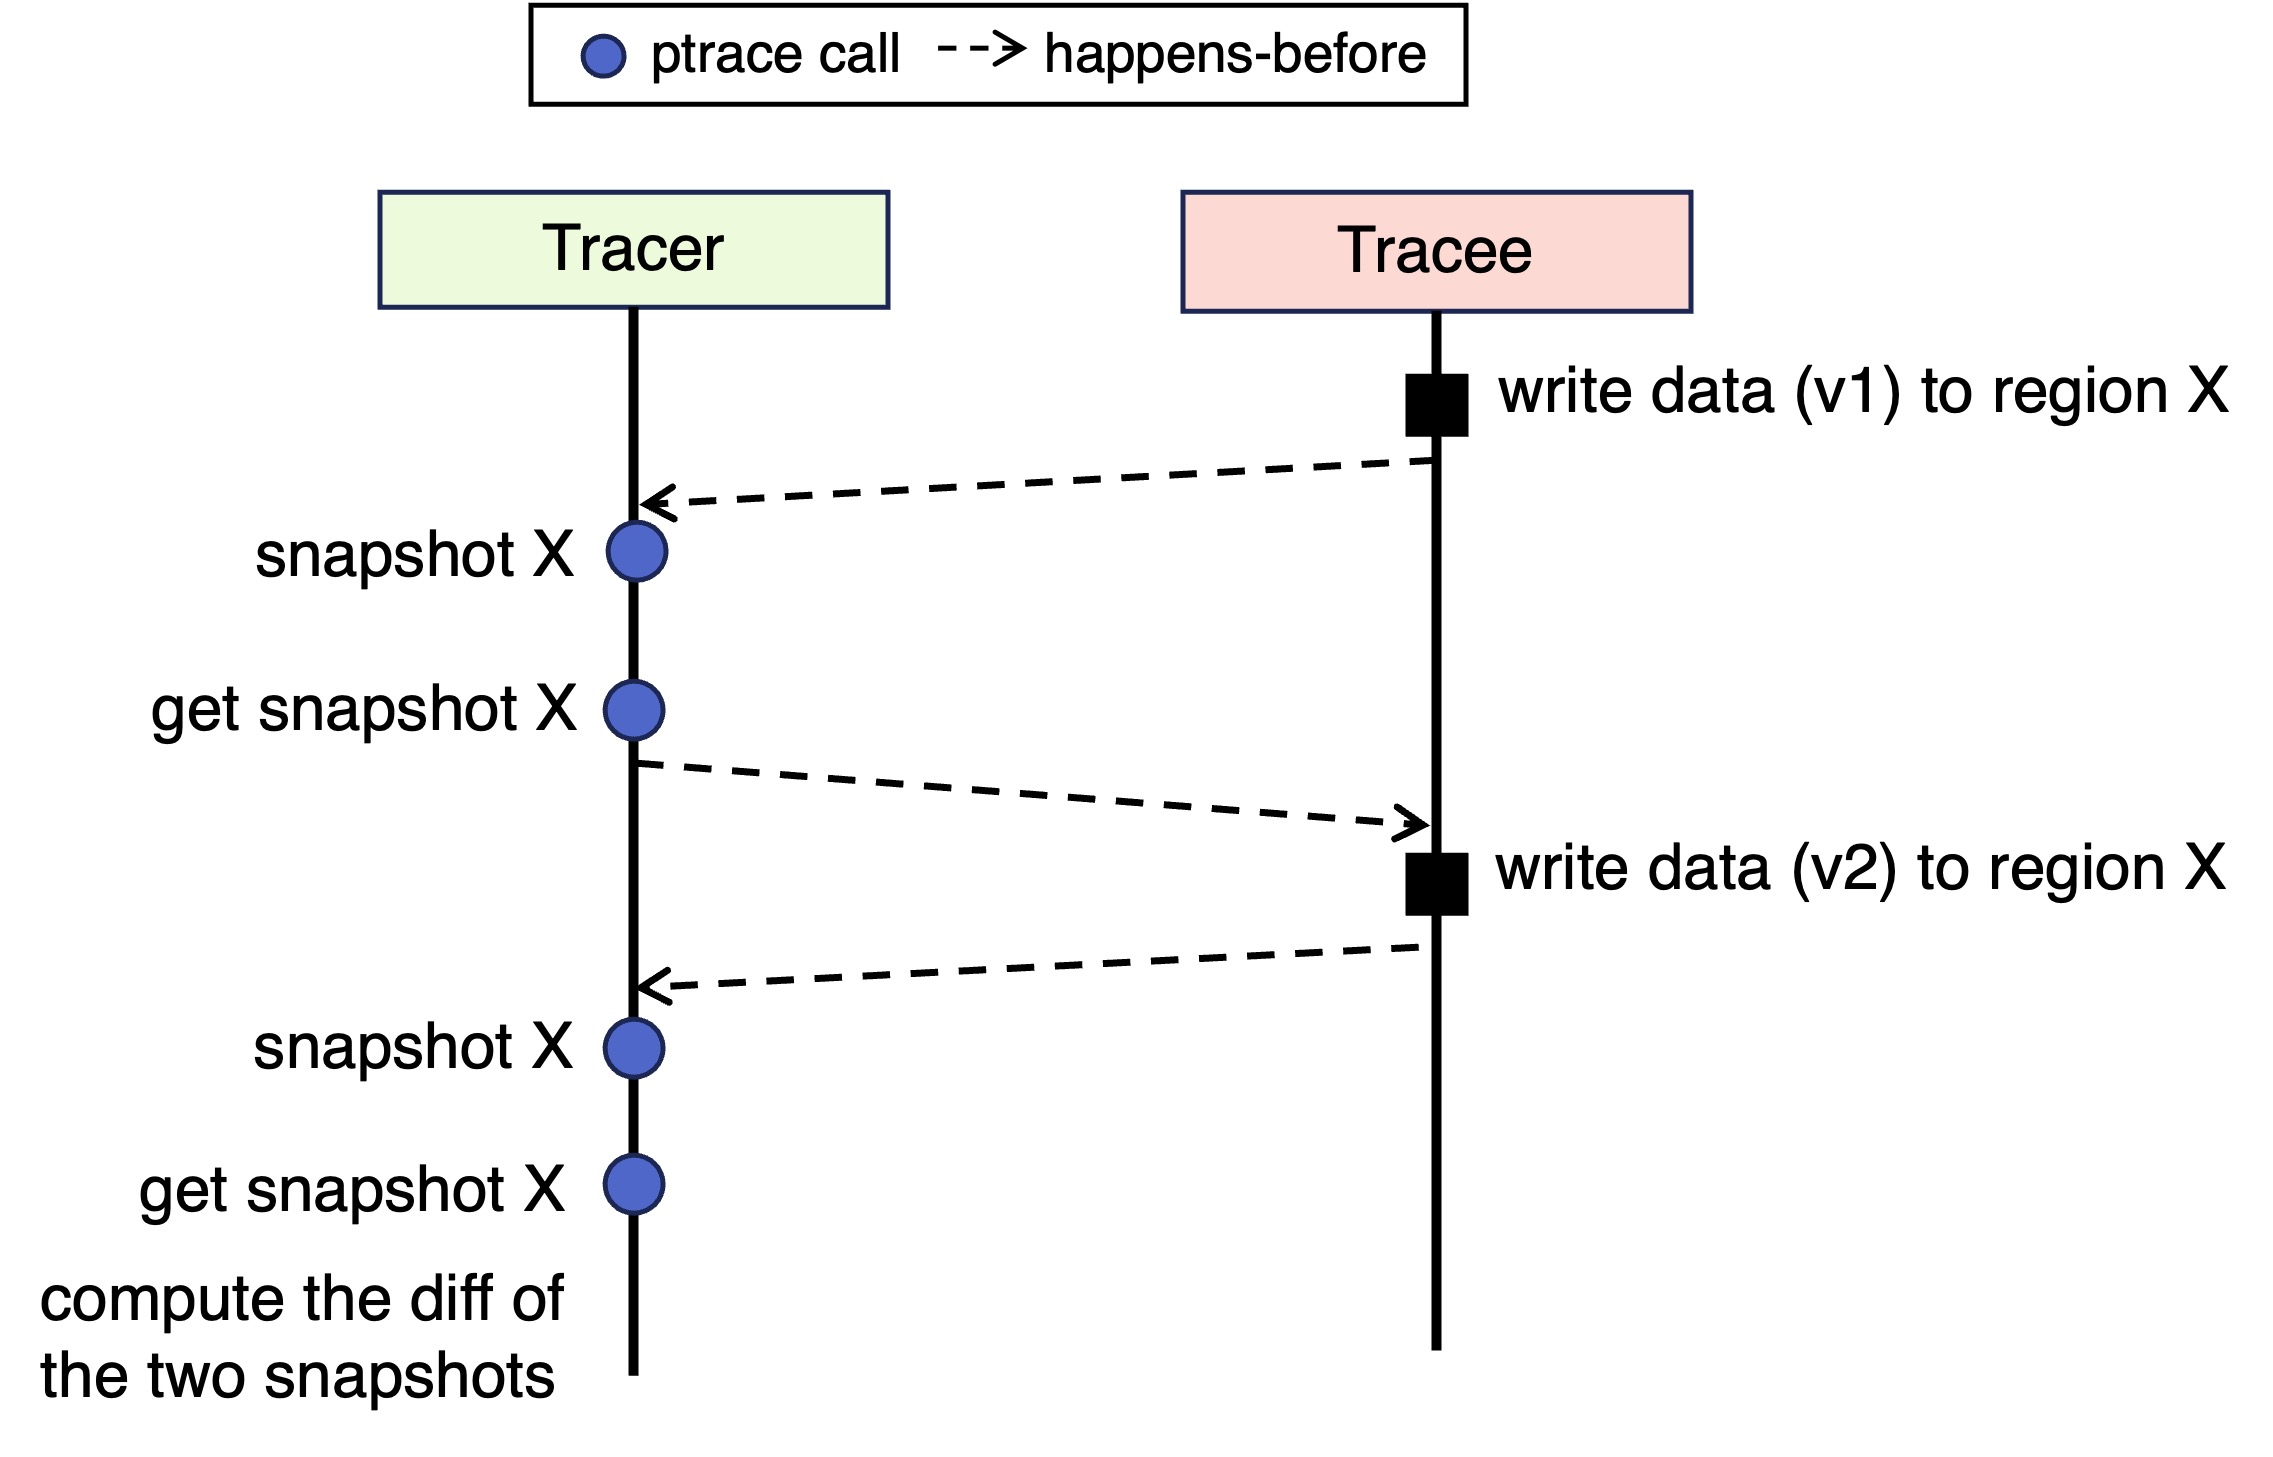
PTRACE_SNAPSHOTfor snapshotting a memory regionPTRACE_RESTOREfor restoring the snapshot for a memory regionPTRACE_GETSNAPSHOTfor reading the snapshot for a memory region
You need to figure out the specific kernel source files to make the changes.
The memory region to snapshot is specified by the tracer, with a start virtual address and a length. You need to ensure that the snapshotting only captures a valid, writable memory region in the tracee. If a memory region specified for snapshotting is invalid or not writable, the ptrace call should return an error according to the existing convention ,which you can find in the man page. At the time of a restore operation, you also need to perform the same checks for the specified memory region.
The snapshot should be stored somewhere in the kernel space. Accordingly, the restore operation uses the corresponding kernel space snapshot to write to the tracee’s memory region. The get snapshot operation retrieves the snapshot from kernel space to a user-space buffer specified by the caller (the tracer).
Multiple memory regions in a tracee may be snapshotted. There can also exist multiple tracees. You need to store the snapshots properly (e.g., so they belong to the correct tracee), and ensure that they can be efficiently retrieved later. For simplicity, you can restrict that at most one snapshot is saved for each memory region, and old snapshots will be overwritten. Once a snapshot is successfully restored with PTRACE_RESTORE, the snapshot should be deleted. When the tracee is terminated, all of its snapshots, if any, should also be deleted.
Because the snapshots are stored in kernel space, you need to enforce reasonable limits, e.g., a MAX_SNAPSHOT_LEN for each snapshot and a MAX_TOTAL_SNAPSHOT_SIZE for each tracee. If these limits are reached, you need to have proper error handling.
In your writeup, document the major changes you made for implementing the feature. Your code implementation should be submitted in the format of patches to the vanilla Linux kernel 5.10.224.
1.3 Test Selective Memory Snapshotting
Write a user-space program that tests the selective memory snapshotting feature. The memory region(s) to be tested should be heap allocated memory (e.g., a struct allocated with malloc). You cannot hard code an absolute starting address to pass to the ptrace calls.
Your program should test at least the following two scenarios:
Use signals to coordinate the operations between tracer and tracee.
Take a screenshot of running your test program and its output. If the output is long, save the output as a file. Indicate whether your program’s output is expected or not.
Submission
Your hand-in should include the write-ups for each exercise as well as the related code you wrote. Cite any sources that you consulted while completing the exercises.

